
South Africa is the most developed data centre market in Africa, hosting roughly 70% of the continent’s capacity across more than 50 facilities.
But behind the growth story sits a harder reality: these are among the most power- and water-intensive sites in the economy, and energy cost, water use, reliability and carbon intensity have become the defining constraints on the industry.
At ECS, we believe the operators who will win will be the ones who can see exactly where their energy and water go — and what it costs them.
A market growing faster than the grid
The numbers tell the story. The South African data centre market was valued at around USD 2.55 billion in 2025 and is projected to reach USD 5.28 billion by 2031, growing at close to 13% a year.
Johannesburg leads with more than 15 operational facilities, Cape Town is expanding rapidly as a subsea-cable gateway, and Durban and Centurion are adding new capacity. Hyperscale cloud investment from AWS, Microsoft Azure, Google Cloud and Oracle, new subsea cables, rising AI workloads and data-sovereignty regulation are all driving demand. (Source: Arizton, South Africa Data Centre Market Investment Analysis 2026-2031)
The problem is that this demand is landing on a grid that remains coal-dominated — roughly 85% of the energy mix — and generation-constrained.
Individual campuses now draw between 50 MW and 174 MW, comparable to heavy industrial and mining loads. Those same campuses are also large water users: a facility running traditional evaporative cooling can consume in the order of 25 million litres a year for every 1 MW of IT load, which is why new developments now face as much scrutiny over water as over power.
Energy, water and carbon have shifted from a back-office concern to the single biggest differentiator in the market. (Source: World Economic Forum, Circular water solutions key to sustainable data centres, 2024)
The pressures every operator is feeling
Whether an operator runs on grid electricity, wheeled renewables (solar and wind), rooftop solar, diesel backup or a hybrid of all four, the same pressures keep surfacing:
- Rising electricity costs. Data centres run 24/7 and draw primarily from Eskom, incurring very high electricity bills and a large Scope 2 carbon footprint.
- Diesel dependence during grid interruptions. When the grid falters, facilities switch immediately to backup generators — the source of their Scope 1 emissions and a significant running cost.
- Water use and water risk. Cooling is thirsty work. Traditional evaporative cooling is extremely water-intensive — in the order of 25 million litres a year per 1 MW of IT load — and in a water-scarce country that turns water into a cost, sustainability and permitting issue in its own right, not a footnote to energy. Municipalities are increasingly asking operators to account for every kilolitre before approving a build.
- Maximum-demand penalties. Tariffs penalise demand drawn above the agreed maximum. Because cooling load is relatively fixed while IT load fluctuates, peak spikes can trigger large penalties.
- Rising carbon, water and compliance scrutiny. Scope 1 and Scope 2 reporting is a legal obligation, not a voluntary disclosure. Facility-level greenhouse gas reporting is mandatory under the National Greenhouse Gas Emission Reporting Regulations, 2016 (GN 275 in Government Gazette 40762 of 3 April 2017, as amended, issued under the National Environmental Management: Air Quality Act, No. 39 of 2004) for operations conducting a listed Annexure 1 activity above the stated threshold — and stationary combustion, including diesel standby generation, is a listed activity.
- Scope 1 emissions are priced under the Carbon Tax Act, No. 15 of 2019, and that price is escalating sharply: the Act steps the rate up from R236 to R308 per tonne of CO2e on 1 January 2026, and on to R462 per tonne by 2030. Layered on top, the Climate Change Act, No. 22 of 2024 — which partially commenced on 17 March 2025 — provides for sectoral emission targets and company-level carbon budgets, and the draft National Greenhouse Gas Carbon Budget and Mitigation Plan Regulations set a first commitment period running from 1 January 2026 to 31 December 2030.
- The direction of travel is not in doubt, even though the carbon budget provisions (sections 27 and 28) are not yet in operation and those regulations remain in draft as at August 2026. (Sources: NGER Regulations, 2016 (as amended); Climate Change Act 22 of 2024; SARS Carbon Tax; DFFE draft Carbon Budget & Mitigation Plan Regulations)
- Complex, multi-source supply. Reconciling grid, wheeled solar and wind, rooftop PV, diesel backup and water into one accurate picture is a genuine metering and baselining challenge.
This last point is worth dwelling on. As operators sign wheeling agreements — moving power from remote solar and wind farms across Eskom and municipal networks — they take on an inherently complex reconciliation problem.
Accurate, auditable metering between generators, Eskom, municipalities and the end user — and, increasingly, across water supply too — is no longer optional; it’s the foundation of both cost control and credible reporting.
Where ECS fits: start with visibility
Our view is simple. Before an operator can optimise anything, it has to be able to measure it. That is why ECS leads not with a full energy-management overhaul, but with a focused capability built around energy, water and carbon tracking — immediate operational visibility through continuous monitoring and reporting.
The day-one offering covers the essentials:
- Continuous energy tracking — measuring exactly how much energy the facility consumes throughout the day.
- Water consumption tracking — metering water draw system by system, benchmarking Water Usage Effectiveness (WUE) alongside PUE, flagging leaks and anomalies early, and giving operators the auditable water record that permitting authorities and ESG frameworks now expect.
- Carbon footprint tracking — automatically quantifying Scope 1 (diesel) and Scope 2 (grid electricity) so operators know their true CO₂ impact.
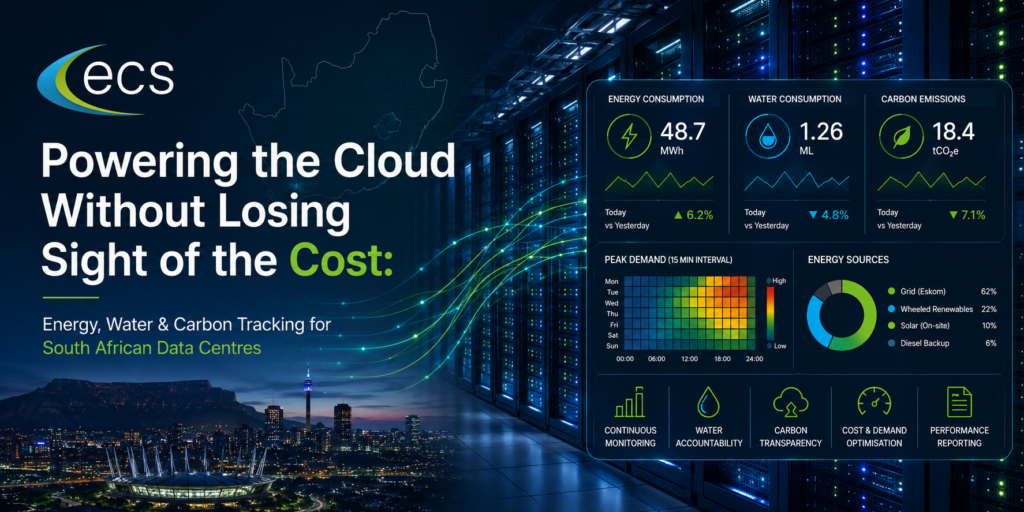
- Peak vs off-peak demand visibility — demand heat-mapping that shows high- and low-demand hours across the week, helping manage maximum-demand penalties.
- Performance reporting — performance reporting delivered, covering energy, water, demand profile, carbon emissions and operational trends on a single view.
- Carbon offset identification — pinpointing where reduction and offset initiatives can deliver measurable value.
Why it matters
The positioning is deliberately diagnostic rather than predictive: telling operators what is happening and what they should be doing about their demand and their water use, today. Predictive analytics is a natural later evolution — but visibility comes first, because efficiency is the cheapest megawatt — and the cheapest kilolitre — an operator will ever find.
For data centre operators, better visibility translates directly into better decisions. It helps them:
- Reduce unnecessary energy costs and avoid demand-charge penalties.
- Track and reduce water consumption, and stay ahead of tightening water-use and permitting requirements.
- Understand their true carbon performance across Scope 1 and Scope 2.
- Improve ESG reporting and get ahead of tightening disclosure requirements across energy, water and carbon.
- Prepare for future compliance — the kind of emissions, diesel and water detail regulators are already demanding at planning stage.
- Make better day-to-day operational decisions on cooling, demand and backup.
Built for South African data centres
ECS has already developed this tracking and demand heat-mapping capability through our work in energy management and measurement & verification.
Adapting it for the data centre environment — and extending it across water as well as energy and carbon — is a natural extension, one that gives operators a single, consolidated view of energy and water performance regardless of how many supply sources they juggle.
As South Africa’s data centre boom accelerates, the operators who treat energy, water and carbon as something to be measured, managed and reported — not just paid for — will hold the advantage. We would like to help you get there.
Let’s discuss your energy & water performance
Book a 30-minute discovery session or email info@enerserv.co.za to see how ECS can help your data centre improve energy and water visibility and carbon reporting.